What are Raster Data Formats in GIS and Remote Sensing
Raster Data Formats used in GIS and Remote Sensing
Earth surface features including man-made features can be represented in GIS and remote sensing processes as spatial data. Spatial Data in GIS and remote sensing has two primary data formats to create information
- Raster
- Vector
Earliest
GIS software was either Raster based or Vector based, but now most of the GIS software has data processing capabilities in both formats. Advances in computer technology have
largely eliminated the boundaries between Raster and Vector data for GIS applications.
An integrated raster and vector data working environment provides
many more opportunities as one can combine the mathematical methods and simulations suitable for both the
formats in the analysis. Both formats have their advantages and disadvantages.
RASTER DATA
Raster
data have become the primary source of spatial data in geographic databases and
are used increasingly in a wide variety of GIS applications. Raster data defined as representing earth surface feature including man-made and natural in grid/cell forms. Its mean all
the raster data represented by image, cell and grid formats. The satellite images are recorded in raster format.
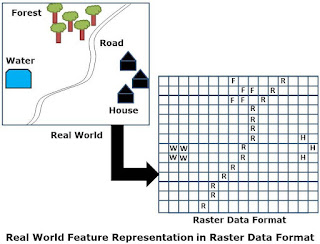
Representation of Raster Data
Raster
data representation can be defined by this explanation- study area is divided
into regular cells of specific dimensions and the measurement or attribute of
each cell is represented by a digital code.
Locations of raster cells are not
explicitly recorded but are inferred from their positions in the image. In general
raster data can be represented by a matrix (2D array), where each cell is
indexed by row and column numbers.
Raster data representation of Features
- Points features by single cells
- Line by sequence of neighboring cells
- Polygons by collections of contiguous cells
Each
cell in raster format carries a value as either an integer or floating point
number. Integers are used to typically define a category such as 1 for water, 2
for forest, whereas floating point numbers typically represents continuous data
such as ground water quality data, temperature, average annual precipitation, elevation etc.
Organization of Raster Data
Raster
data are usually organized into layers, which are also known as bands, themes
or grid. Each layer have a specific characteristic based n theme such as
topography, soil type, drainage, vegetation cover, land use etc. Raster data
model is better suited for continuous phenomena and also used raster data model
to represent discreet features as well.
Raster Coding
There
are many ways of raster coding it can be
1. Presence/Absence
We
can use numbers to indicate presence/absence of any specific entities. In
general 0 is used to indicate absence.
2. Cell Center
Whatever
feature is present at the center point of each cell may be recorded in the
cell.
3. Dominant
Area
For
coding polygons, cell that contains more than one type of feature, then
classify the cell based on the feature occupying maximum space in that cell. Each
pixel or cell is assumed to have only one value.
4. Percentage
Coverage
For
each type of feature, the percentage it occupies in any given cell is used to
code the raster data.
Advantages of Raster Data Model
- Raster data model is capable to represent different types of continuous surfaces. Such as Topography, land use/land cover, air quality, ground water pollution level etc. can be stored at raster layers.
- Raster data model support fast computer processing. Such as fast display of surface data, ability to handle very large databases, Tiling, Compression to reduces storage requirement.
- Many spatial and modeling applications work only on data in raster format. For example, hydrologic modeling such surface runoff modeling, elevation modeling and pollution modeling
- Remote Sensing Data are the major source for input data in analysis is based on raster data model.
Limitations of Raster model
- Rater data model is not suitable for applications that rely on individual spatial features represented by points, lines and polygons. For example network analysis.
- Precise locations may not be recorded in raster data as compare to vector data.
- Features are usually generalized in raster data and do not appear as cartographically pleasing as vector data.
- Resolution of raster data determines applicability of raster data. With the increase in resolution it increase data volume and affect the computer processing speed.
V V meaningful
ReplyDeleteV beneficial information n
Nice message