Ground Water Level Prediction using Geospatial Technology and Mathematical Models
Ground water studies play significant role in monitoring and planning of water resources for water supply for day to day requirements. Surface water resources are limited and completely depends upon the rainfall scenario. If good rainfall then the surface water resources such as pond, lake and dam can provide water to cater population for longer period. But in case of low rainfall, the scenario will be reverse, less water availability in pond, lakes and dams to supply water. This less rainfall scenario exert the pressure on ground water availability and in areas where no proper water supply system exists, those are also dependent on ground water availability. Ground water availability and its quality plays important role in its uses for drinking and agricultural purposes.
Ground water availability defined by ground water level, which defined the depth of water table. Ground water level data collected by local government authority by physical survey and one can collect these data from respective department. These data collected by department in both period’s “pre-monsoon and post-monsoon” as well as department assess its chemical properties, which ultimately defined as water quality parameters. These ground water level data are based on bore well, dug well and other wells of government and individual person located in that district.
Geospatial technologies are best tool to analyse ground water level data spatially, which provide complete ground water level information of that area. By using these technologies one can analyse the past conditions as well as current conditions and also changes took place during that period in ground water level.
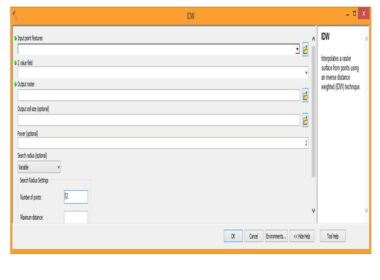
This geospatial methods are very commonly used for ground water level mapping as well as for change detection analysis. For geospatial analysis, in the beginning ground water level layer generated in GIS based on surveyed data/collected data, with coordinate information. A point layer generated in GIS which is further used to create continuous layer in GIS. Interpolation techniques such as kriging, IMW and linear are used to generate continuous layer in GIS. This interpolated layers were masked using administrative boundary data such as village/tehsil/district boundary. Then these layers are compared for specific periods to find the change in ground water level.
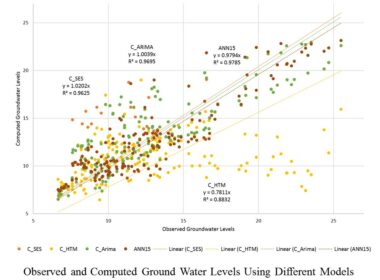
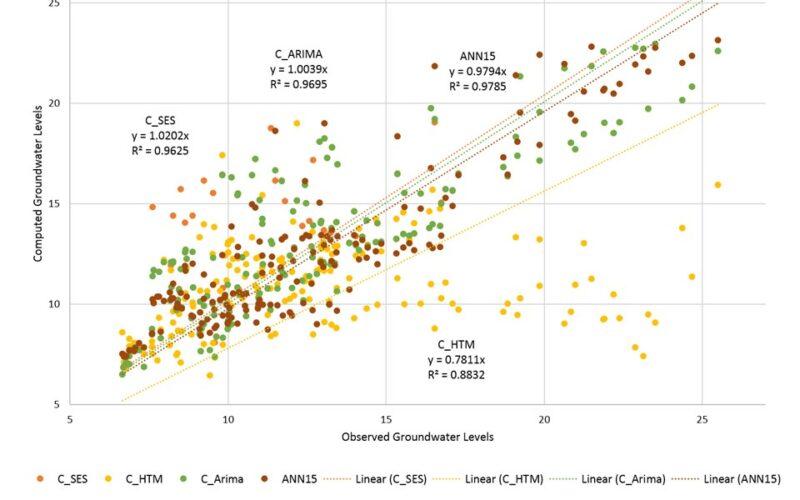
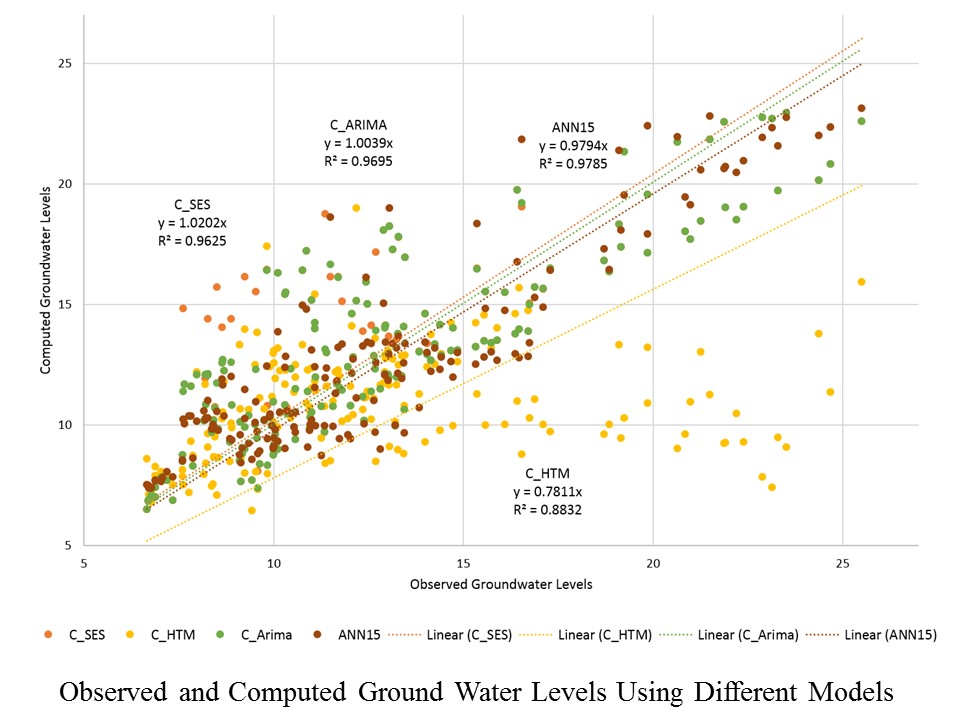
In the next level of geospatial methods, these generated time series data of ground water level can be used to understand the future scenario of ground water level in that area. Time series models and neural network models could help to predict ground water quality and ground water level in advance to understand the future scenario. Different time series forecasting models (Simple Exponential Smoothing, Holt’s Trend Method, ARIMA) and Artificial Neural Network models can be used to predict ground water level.
For the development of an optimized model, a wide range of models need to develop, trained and used for the prediction of water level. The simulated/predicted values of water level for year can be compared with the observed values of existing data. The performance of these models were evaluated using different indices like root mean square error (RMSE), mean absolute error (MAE), and Nash-Sutcliffe coefficient of efficiency (NSE) to understand the goodness of fit for the observed and simulated values.
Interpretation of Ground Water Level Maps
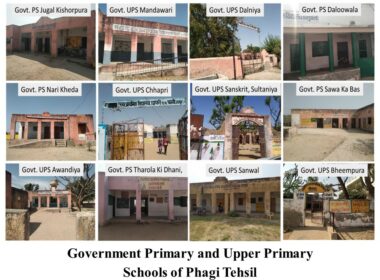
It is found from village level spatial distribution based on predicted data, that situation is alarming in northern villages of Phagi tehsil as deeper water level were observed in Renwal Manjii (25.5mbgl), Beer Ramchandrapura (24.67mbgl), Daloowala (24.37mbgl), Ganeshpura (23.52mbgl), Hari Rampura (23.29mbgl) and Dabla Khurd (23.14mbgl) during pre-monsoon period of 2019. The water level predictions for year 2024 indicate that in next five years some more villages will face significant drop in ground water level like Dabla Bujurg (23.6mbgl), Nihalpura@Miyan ka bas (23.16mbgl) and Karwa (23.37mbgl).
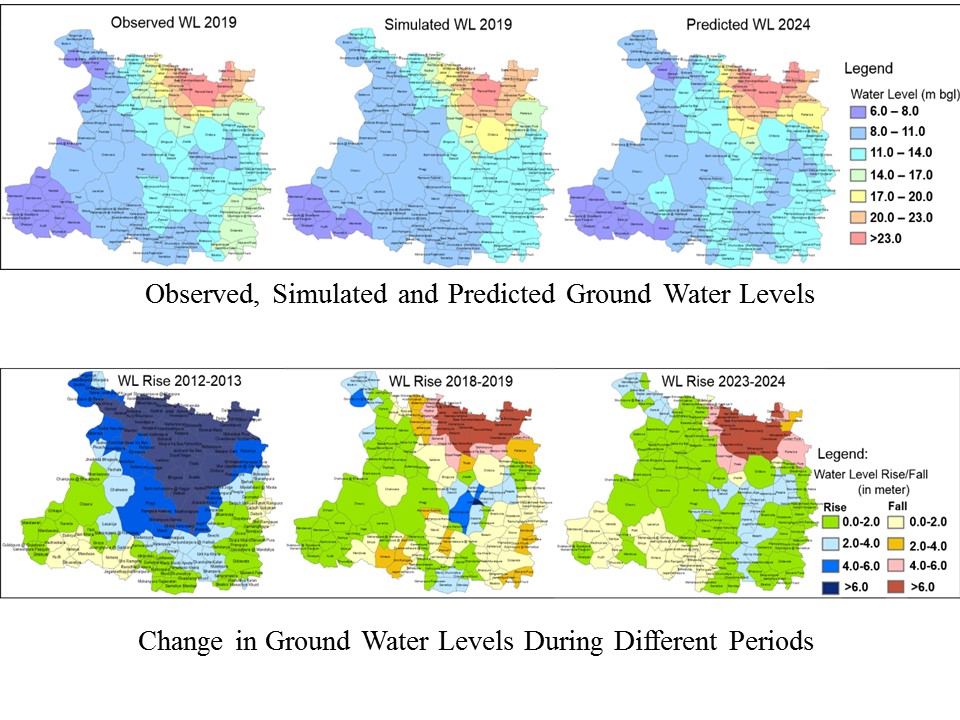
GIS used to evaluate rise in water table during by comparing two years data simultaneously. The spatial and temporal changes in water level rise/fall during pre-monsoon season of 2012-2013 indicates that most of the villages of Phagi tehsil shows more than 4m rise especially in northern and central part of tehsil.
The decrease in ground water of more than 6.0 m has been observed in northern villages of Phagi tehsil during specific period, which indicates the excess utilization of ground water for irrigation and domestic purposes.

Use Quadric Platform for Geo Spatial Data Analysis : A No-Code Platform.