LISS IV Satellite Data of Phagi Tehsil for Mapping
Satellite data/images can be used for mapping of natural as well as man made features. There are variety of satellite images are available for free and on the basis of payment. Acquiring of satellite images depends on objective of research/project and as per the project requirements one can purchase or download free available satellite images.
The satellite images can be selected on the two important properties of sensor, those are spatial and spectral resolutions. These two sensor properties defined the quality and quantity both parameters of a satellite images. Spatial resolution defined about the detailed information of earth surface feature available in a satellite image whereas spectral resolution defines the number of wavelength deployed in sensor to record earth surface reflectance.
Therefore selection of satellite image for any project will be carried out using above two properties of sensor. Based on this, to fulfill the requirement of project objectives, one give emphasis on both sensor propertied or may only on one properties. For example, if project is focusing on built-up, agriculture, water body and barren land mapping only no need of further categorization of these category then medium spatial resolution is sufficient whereas if project needs detailed mapping of built-up and its further categorization residential, commercial or industrial, then need to use high spatial resolution satellite images.
In another example, if project does not focus on agriculture mapping/forest mapping/vegetation mapping then one can stay with three wavelength of visible band of electromagnetic spectrum. But in the reverse condition when crop mapping/patterns on high priority then use of infra-red wavelength become very important. So with this, it is understood the importance of sensor properties/characteristics in the selection of satellite images as per project requirements.
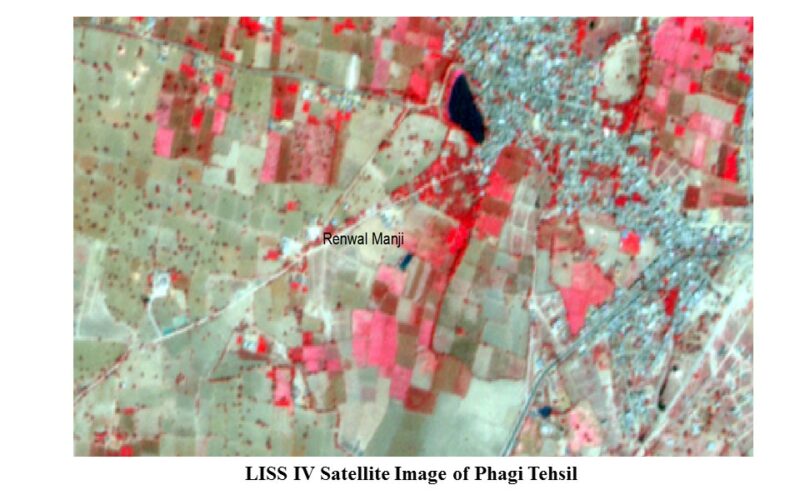
In the mapping of Phagi tehsil LISS IV data was used, this LISS IV sensor stands for Linear Imaging Self Scanning and it is fourth series after LISS-I, LISS-II and LISS-III. This LISS IV sensor is the part of Indian remote sensing satellite mission.

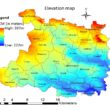
LISS IV satellite data of March 2020 was acquired from National Remote Sensing Centre for entire Phagi tehsil. The spatial resolution of LISS IV satellite data is 5.8 m. The data was developed into Universal Transverse Mercator (UTM) coordinate system, zone 43 North, with World Geocoded system (UTM WGS 84) projection parameters.
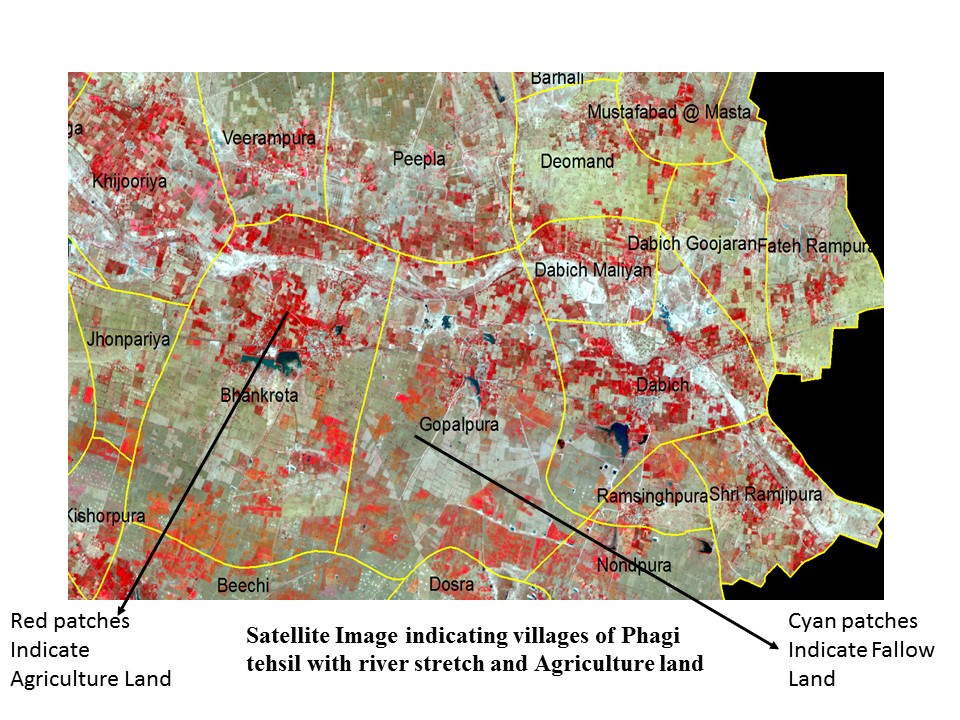
Satellite imagery was stacked into different bands to produce a false colour composite; the area of interest (study area) was extracted by sub-setting of the image using ERDAS imagine software. Image enhancement techniques like histogram equalization were performed on each image for improving the quality of the image.
The pre-processed images were then classified using hybrid classification approach i.e. combination of supervised and unsupervised algorithm followed by visual interpretation. In un-supervised classification method the ISODATA clustering algorithm was adopted, however in the supervised classification technique the maximum likelihood algorithm was used to classify the image based on the training sets (signatures).

The selection of training sets provided by the user based on the field knowledge. The training data given by the user guides the software as to what types of pixels are to be selected for certain land use/land cover type.

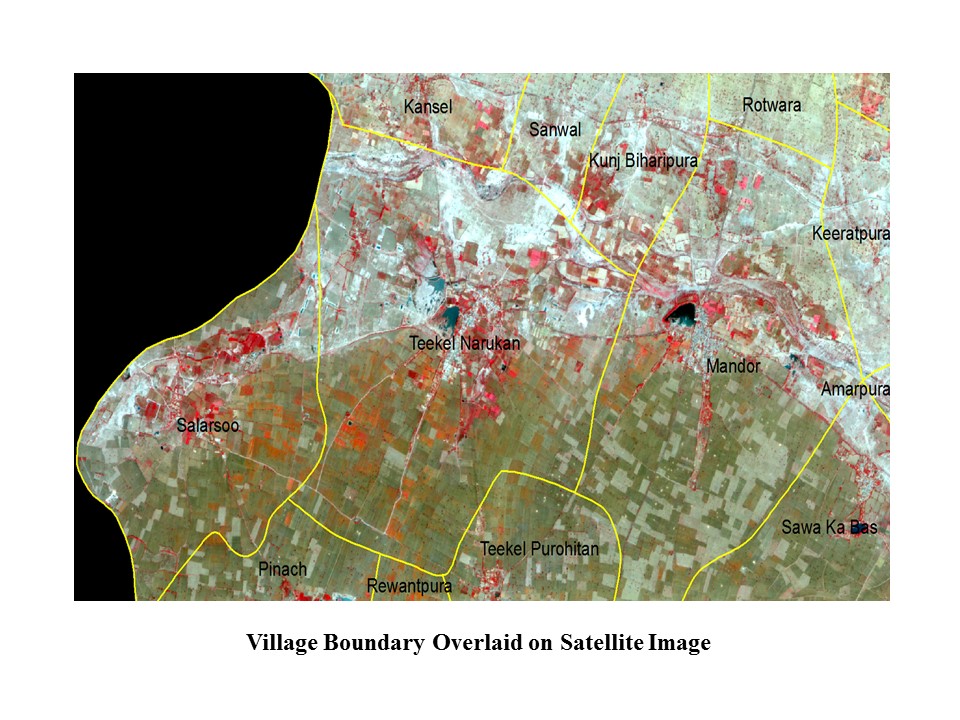
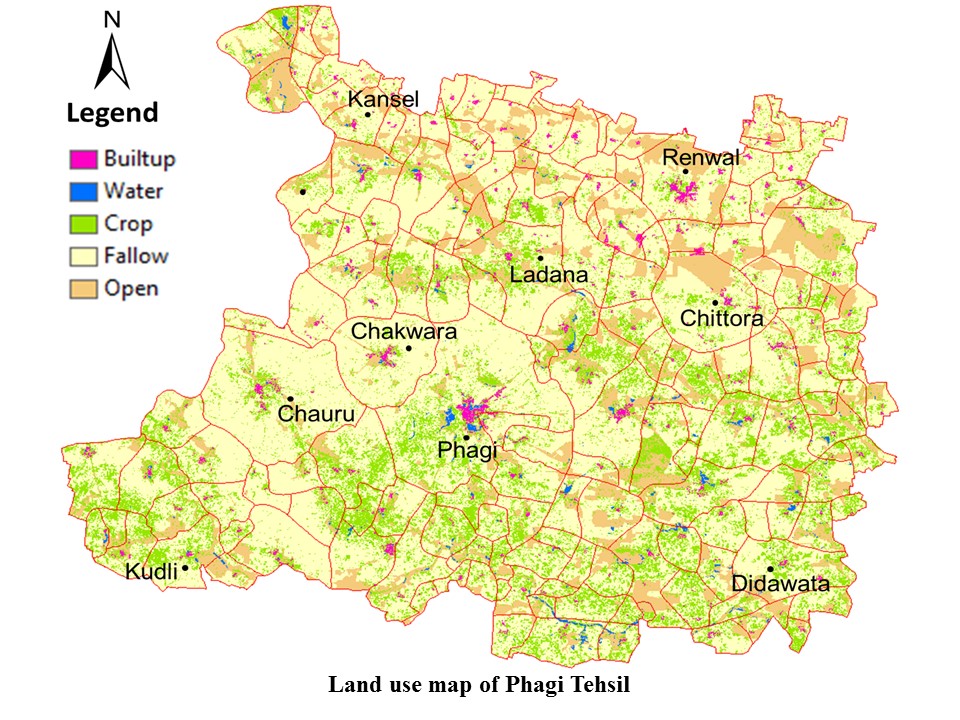
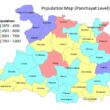
The land use/land cover data classified into various classes viz. built-up, cropland, fallow land, open land and water body. Village boundary is overlaid on satellite data for better understanding of land use of Phagi tehsil.
The classification results were re-checked with ground data and other secondary data to find out wrongly classified or missing pixel and these pixels were updated adequately. The overall accuracy was used to determine the classification accuracy by comparing the classified output with the ground truth locations using Erdas Imagine.
I appreciate the work and effort that went into this article. This paragraph provides you with a clear picture. Without a question, it is an insightful piece that may assist us in expanding our understanding. satellite wireless connection