GIS for Generation of Population map
GIS is a versatile tool, which can be used to create, edit, analyse and display data/information as per user requirements. As it is known that GIS can be used to create data for natural resources as well as for human induced activities. But this is not limit of GIS for creation of data, instead of these GIS can be used to create demand and supply for transport system, master planning, Covid Cases mapping etc. But to create all these above GIS layers, one should have population data as a key input of GIS database in the process.
The population data can be collected by census portal or purchased from census office. Census department provide population data at all levels or unit for users such population data at state level, population data at district level, population data at city level, population data at ward level, population data at tehsil level, population data at village level etc. So one can create population data at any level as per objective and need of research or project.
This population data is one of the part of demographic data, which can be processed in GIS environment as per need of project. Its mean other demographic/social data such as income, age etc. can be created in GIS very easily and at any level such as village, city, ward and district etc.
As it is known that demographic data collected at individual house unit and conversion these data at ward level or village level as well as representation is not easy. So GIS allow to create continuous layers of these demographic data for further analysis at all levels.
The advantage of having GIS layer of demographic data is to analyse parameters spatially. These demographic data can be integrated with simulation model to predict the future scenario. These demographic spatial data can be used to assess the infrastructure planning, impact on natural resources and demand & supply analysis.
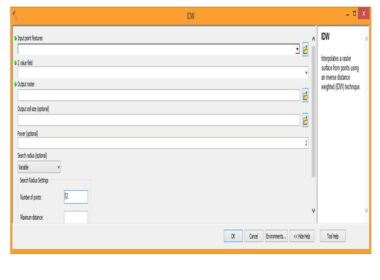
Population map of a study area could be easily created using GIS. To create population map one need to have population data of area (such as village/ward/district) as per need. Then these data imported in GIS Platform to create spatial database or these imported data can integrated in existing GIS layer such village boundary/ward boundary etc.
These integrated/created data can be used to create a separate GIS layer of population map. The created GIS layer of population can be used as map directly and also can be used as input to simulation models as a input factor/variable for finding the impact of population growth.
As we know that the population of an area indicates the number of people living in a village/town/city. Population map will help you to spatially analyse the areas with least or most crowded areas.
However population density maps are used for analyzing the demographic data, for the assessment of infrastructure facilities in an area, health and health facilities requirement and also to assess the impact of population on natural resources/environment.
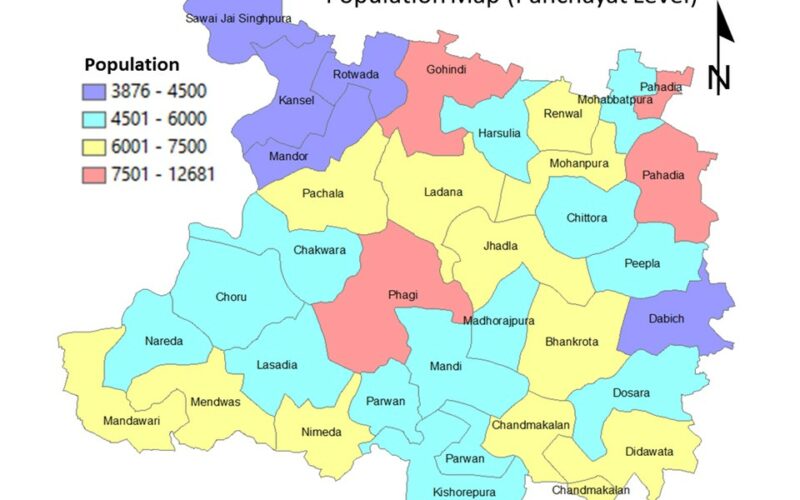
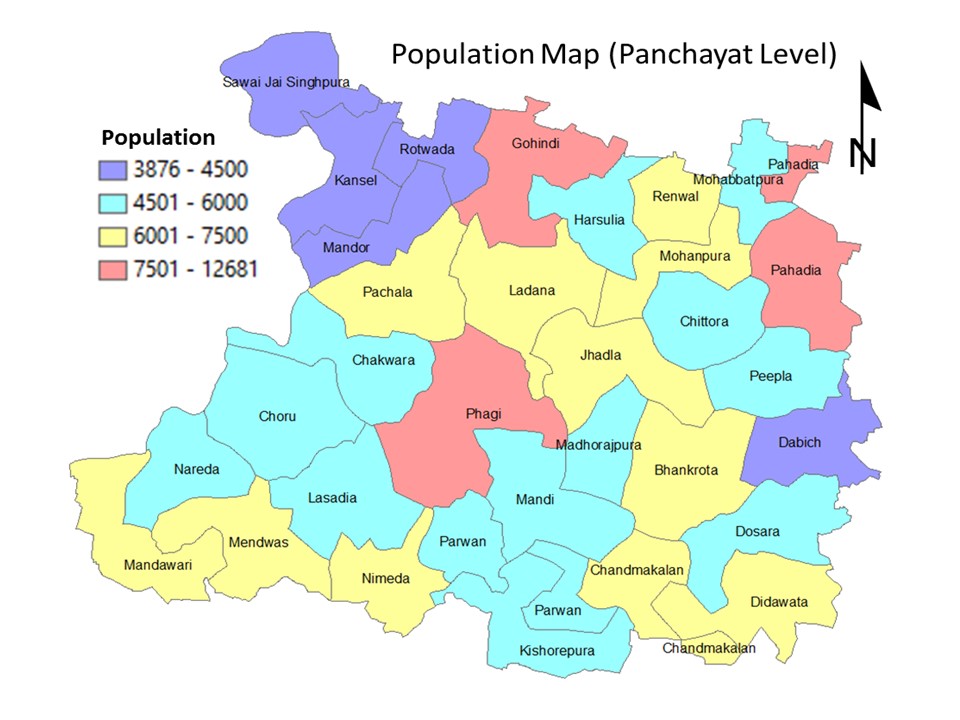
The population density is calculated using the given formula i.e. Population density = number of people/land area. Population map at panchayat or village level could be created in GIS environment as shown for Phagi tehsil.