Elevation and Slope map using GIS
Topographical information/data are very important for the planning and management of resources. These data gives surface elevation information, which plays significant role in road construction/rail alignment, also in natural resource management. As one can understand the importance of the earth’s surface height for the planning and execution of any kind of project on the land.
The accuracy of ground elevation data is vital for the accurate planning and execution of projects. As well as continuous availability of the ground elevation data is a very tedious process for field surveys. Usually one can get benchmarks and contours data in the name of ground elevation. But the interpretation of ground elevation from contours maps/benchmarks is a quite lengthy process to estimate continuous ground elevation data.
Therefore GIS can be used to prepare a continuous layer of ground elevation for any specific area the need. To prepare such layer in GIS, satellite data (e.g. SRTM, Cartosat) can be used as well as toposheets can also be used for creation of elevation data.
Before the creation of an elevation map, we should know what is elevation? And how does it differ from altitude? Actually, the elevation of a geographic location is its height above mean sea level, however, altitude is the vertical distance between the object and the earth’s surface. Elevation maps could be generated using topographic maps or satellite data. Topographic maps are two dimensional maps and allow the person to read or view the elevation and location of land features such as hills, valleys, ridges etc. Contour lines are present on the topographic map to show the different elevations. Now the question arises that what is contour line? A contour line represents an imaginary line of equal elevation i.e. the isoline or we can say the line on a topographic map joining the points of equal height above or below sea level. These contour lines show the height and depth of the land on a map and also give information about the slope i.e. gentle or steep. For example on a steep slope, the contour lines will be closed.
The vertical distance between adjacent contour lines is called Contour Interval. It depends on topography for example for flat terrain the contour interval will be small (0.25 m, 0.5 m, 0.75 m), however for hilly terrain the greater contour interval (5m, 10m, 15m) can be observed. Contour spacing usually depends on the scale of the map as contour interval is inversely proportional to the scale of the map.
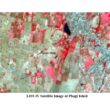
For generation of elevation map one have to use GIS tools with the input data. The input data can be in the form of satellite data such as SRTM or Cartosat. These data can be used directly to get DEM if no error in the data, if any error then one needs to process the data before the final outcome. The elevation and slope maps were generated using Cartosat data (spatial resolution 30 meter).
If one is creating elevation data using toposheets then first need to digitize the contours and benchmarks available in toposheets of the study area. Then use the spatial analysis tool of GIS to create an elevation map. In this process mathematical process such as triangulation need to deploy for smooth elevation map. With this process elevation map which is also called a digital elevation map can be generated.
This digital elevation map can be further used to create different databases such as slope, aspect, hill shade, etc. using tools incorporated in GIS software.
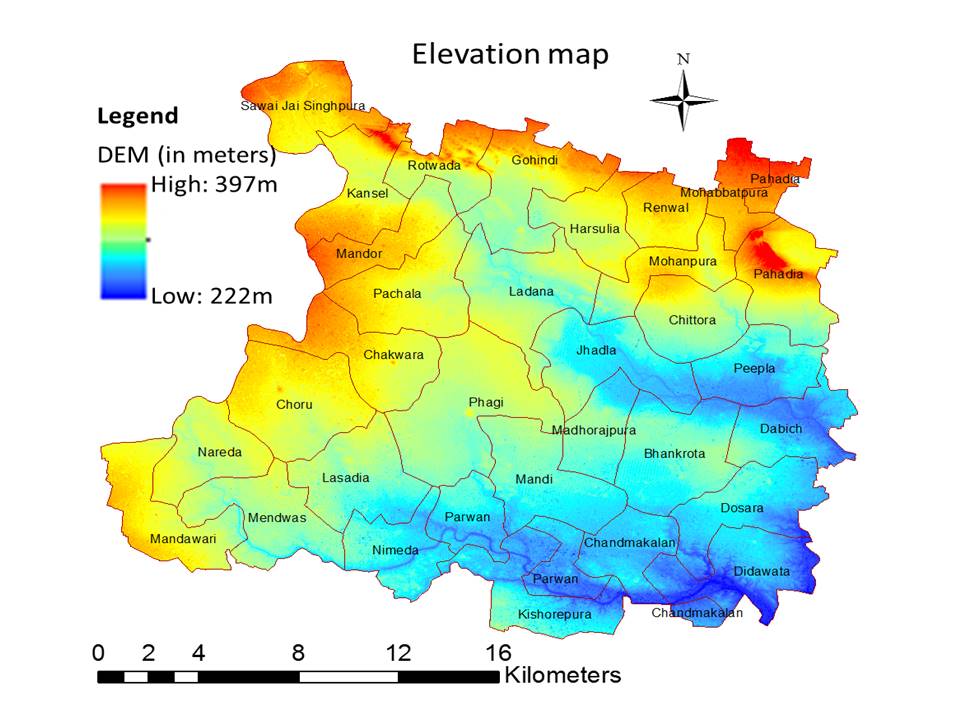
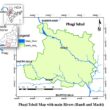
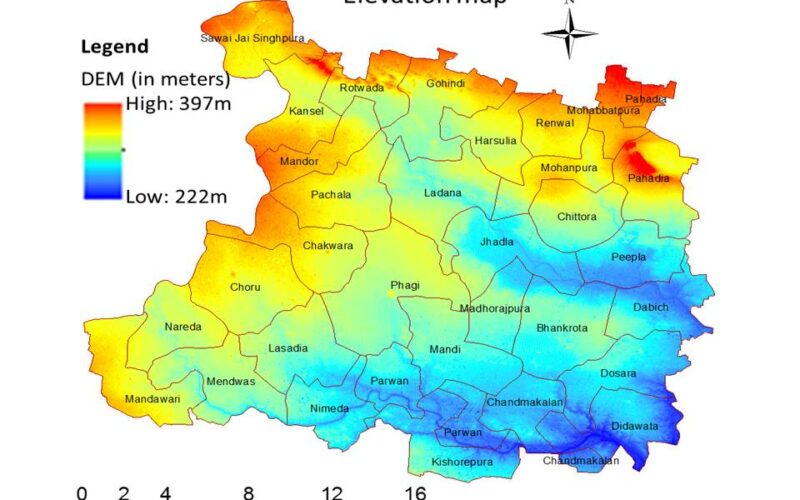
The above digital elevation map is generated using the GIS of Phagi tehsil. The highest elevation in this tehsil is 397m whereas the lowest elevation is 222 meters. Only a few areas have high elevated areas in this tehsil most of the area has an average elevation of 260 meters.
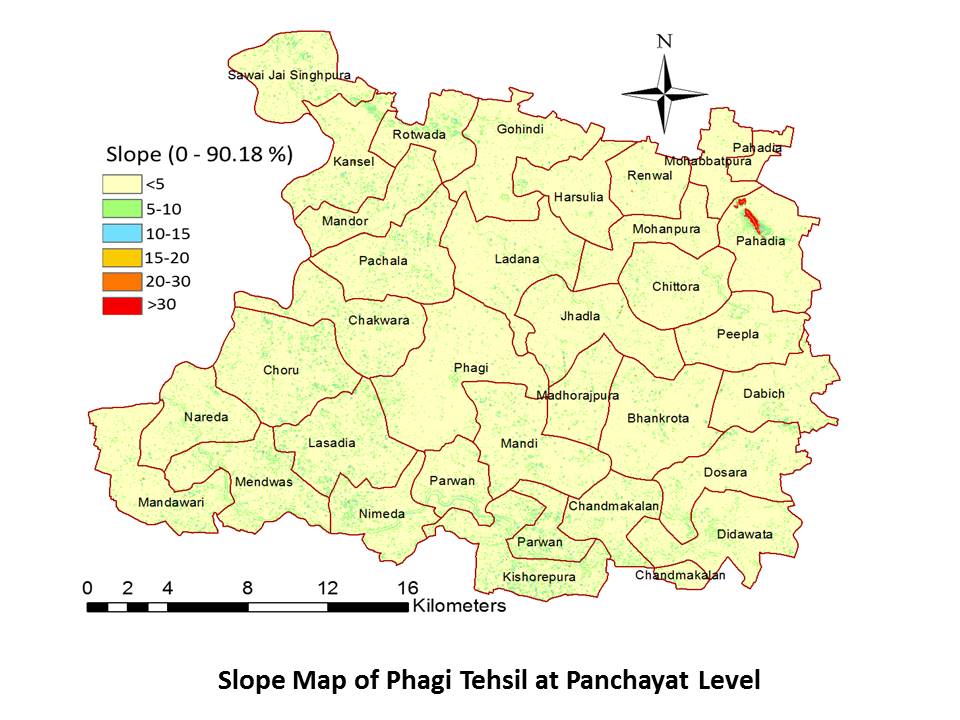
The above slope map is generated using the digital elevation map of the Phagi tehsil. Slope can be defined in percentage as well as in the degree, here in this map slope is defined in percentage. The lowest slope in this area is 5% whereas the maximum slope in this area is more than 30%. By this slope, it is very clearly visible that only one hill area in this tehsil is located in the Pahadia panchayat.
Digital Elevation map and its sub-products are very useful for planning and management of natural as well as man-made resources.